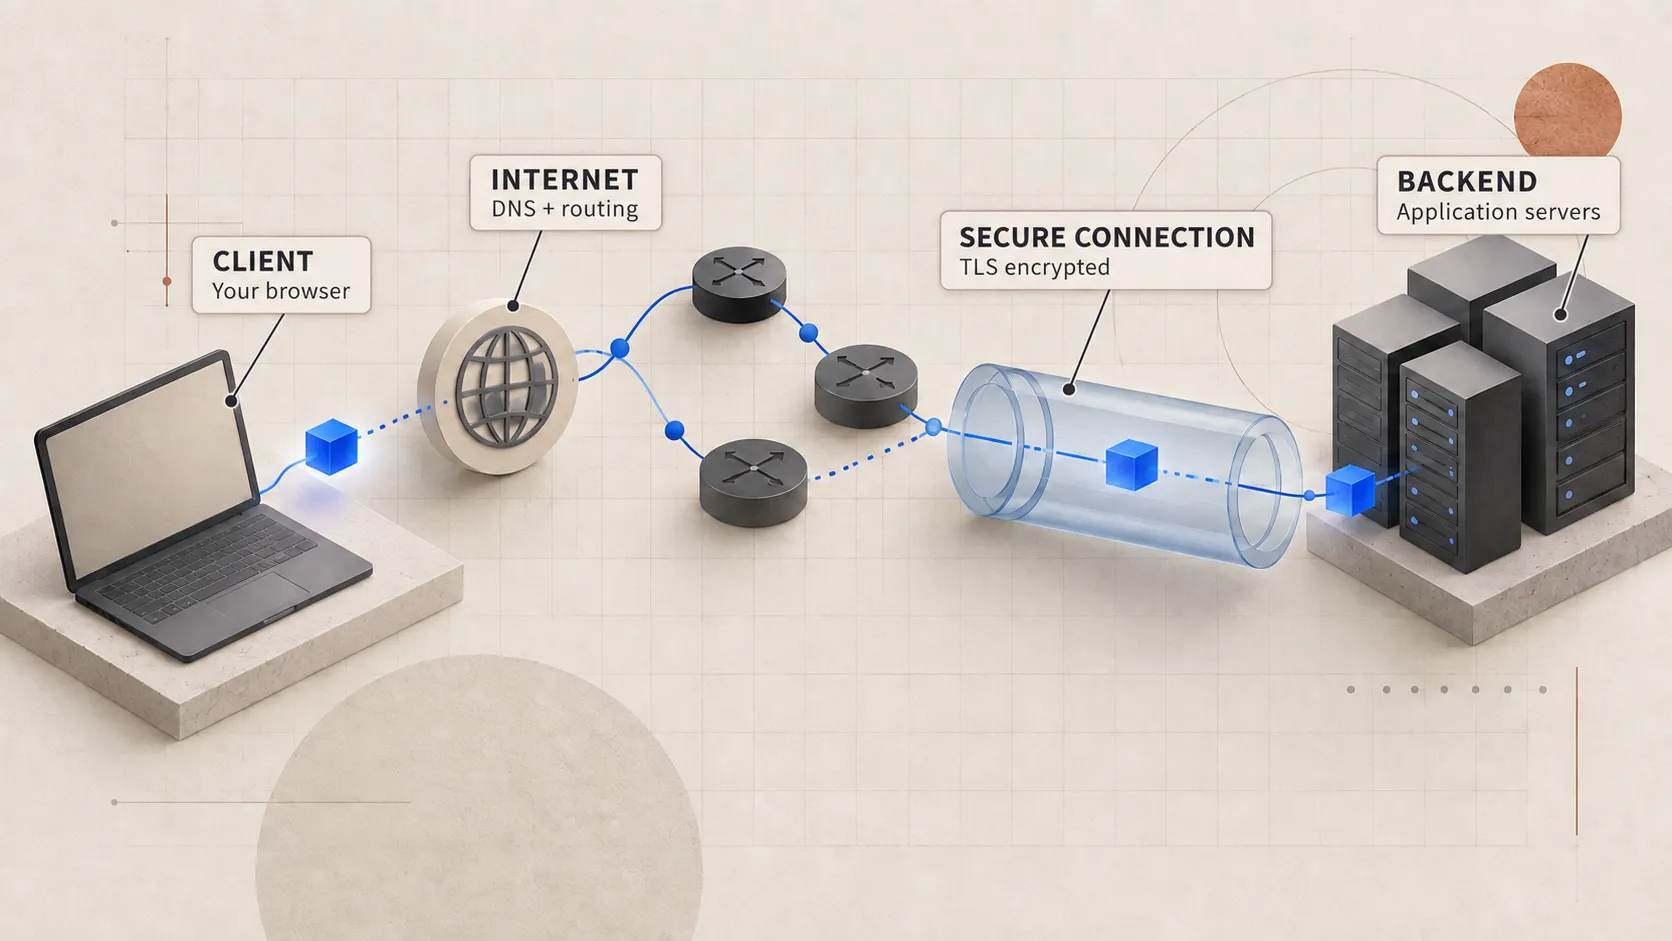
The dashboard says POST /orders took 1.8 seconds. That tells us how long the user waited, but it does not tell us which part of the system needs work.
The delay may be in DNS, connection setup, a load-balancer queue, the event loop, the database pool, query execution, a lock, payment, serialization, or the response network path. Saying “the API is slow” hides all of those different places behind one label.
Good observability should separate those boundaries again.
Start with the user’s clock
I would begin with the user’s full wait before zooming into one service. Browser navigation and resource timing can separate DNS, connection setup, TLS, the request, time to first byte, and content download for eligible requests.
Server timing starts later. If the browser reports 1.8 seconds while the server reports 300 ms, the missing time is outside the application span or the clocks and definitions differ.
A useful latency budget might look like this:
| Stage | Observed time |
|---|---|
| DNS + connection + TLS | 120 ms |
| Edge and routing | 35 ms |
| Application queueing | 210 ms |
| Order handler | 1,280 ms |
| Response transfer | 155 ms |
These numbers are only an example. What matters is that the 1.8 seconds is now split into parts we can investigate.
A trace follows one request
A distributed trace represents the request as spans. Each span has a start, duration, operation name, status, and contextual attributes. Parent-child relationships show causality across services.
POST /orders                         1.28 s
├── pool.acquire                     0.19 s
├── SELECT inventory                 0.04 s
├── UPDATE inventory                 0.03 s
├── payment.authorize                0.91 s
└── INSERT order + outbox            0.06 s
This trace points us toward payment and the database-pool wait. Optimizing JSON serialization would barely change what this user experienced.
A trace waterfall where database pool wait and payment form the critical path while other child spans overlap
The trace context has to cross service and queue boundaries. Without it, the payment call appears as an unrelated operation and the request history breaks at the point where we need it most.
The critical path is not the sum of every span
Two child operations may run in parallel. Adding all span durations can exceed the parent duration.
handler:        |---------------- 800 ms ----------------|
inventory call:    |------ 500 ms ------|
customer call:     |--- 300 ms ---|
Because these calls overlap, they do not add 800 ms to the handler. The slower branch determines when both are finished. That completion sequence is the critical path, and it is the part I would optimize first.
Parallel work is not free, either. It increases simultaneous load and may contend for the same pool. Use it when operations are independent and capacity supports the concurrency.
Metrics reveal patterns traces cannot
One trace explains one request. Metrics tell us whether the same behaviour is affecting many requests.
Track request rate, errors, and the latency distribution. Percentiles are more useful than one average. The p99 is the value that 99% of requests finish at or below; an average of 200 ms can still hide a p99 of six seconds for the slowest 1% of requests.
Compare latency with saturation signals:
- event-loop delay and CPU;
- database connection pool in-use and waiters;
- database lock waits and active sessions;
- queue depth and oldest message age;
- downstream request concurrency and error rate;
- load-balancer pending requests;
- memory and garbage-collection pauses.
Two graphs rising at the same time do not prove that one caused the other, but they narrow the area we need to investigate.
Logs explain discrete events
Structured logs capture facts that do not fit cleanly into aggregates:
{
  "level": "warn",
  "requestId": "req_82d1",
  "orderId": "ord_123",
  "event": "payment_timeout",
  "attempt": 2,
  "elapsedMs": 900,
  "provider": "example-pay"
}
Logs should carry request, trace, and relevant business identifiers without leaking secrets or sensitive payloads. A request ID helps one service. A trace ID connects services. A business ID connects retries and asynchronous work that may outlive the original trace.
Identifiers such as request, trace, and order IDs are useful in structured logs. The expensive mistake is indexing or faceting every unbounded identifier as if it were an aggregation label. Keep identifiers for investigation and use controlled, low-cardinality dimensions for dashboards and metrics.
Instrument queueing explicitly
Queueing is often included inside what looks like execution time, so measure it directly:
- time waiting for a database connection;
- time waiting in a message queue;
- time between socket acceptance and handler start;
- time waiting for a lock;
- time waiting for an available worker;
- time a request spends pending at the proxy.
When a constrained resource approaches capacity, a small increase in traffic can create a large increase in latency. The operation itself may still take the same amount of time after it starts. Most of the new delay is spent waiting for a turn.
Sampling can hide the worst requests
Recording every trace can be expensive. Head sampling decides near the start, before the system knows whether the request will be slow or fail. Tail sampling can retain traces after observing their outcome, making it easier to keep errors and high-latency requests.
Document the sampling strategy. A trace search with no failures may simply mean those failures were not sampled.
Measurement changes need safe labels
Useful span attributes include route templates such as /orders/:id, not raw paths containing millions of unique IDs. Record database system and operation, not full queries with personal data. Capture dependency names and outcomes using controlled values.
Cardinality means the number of distinct values a field can take. A status field has low cardinality; a user or order ID has high cardinality. Using unbounded values as metric labels or widely indexed dimensions can make telemetry expensive or unusable. Sensitive values can also turn an observability platform into a data leak.
A disciplined investigation
For a new latency regression:
- Confirm the user-visible symptom, affected routes, regions, and time window.
- Compare rate, errors, and percentile latency with a healthy baseline.
- Split client, edge, application, and dependency time.
- Inspect traces from the slow tail as well as a typical request.
- Check saturation and queueing at each constrained resource.
- Correlate the change with deployments, traffic mix, data growth, and dependency health.
- Form one narrow hypothesis and test it safely.
I would instrument every place where work waits or moves to another component. Those are usually the boundaries we need to see during an incident.
Once the 1.8 seconds is split across the system, we can fix the part that is actually making the user wait.
Next, 10,000 buyers arrive at once. The code stays the same, but every waiting line gets longer.